
The Local Volume Mapper (LVM), one of the mappers in SDSS-V, is an ongoing optical, integral field unit (IFU) spectroscopic survey that targets the Milky Way, LMC, SMC, and other Local Volume galaxies. The core science goals relate to connecting resolved, parsec-scale individual sources of feedback to ionized interstellar medium (ISM) properties, tracing physics from the energy injection scale up to kpc and global galactic scales.
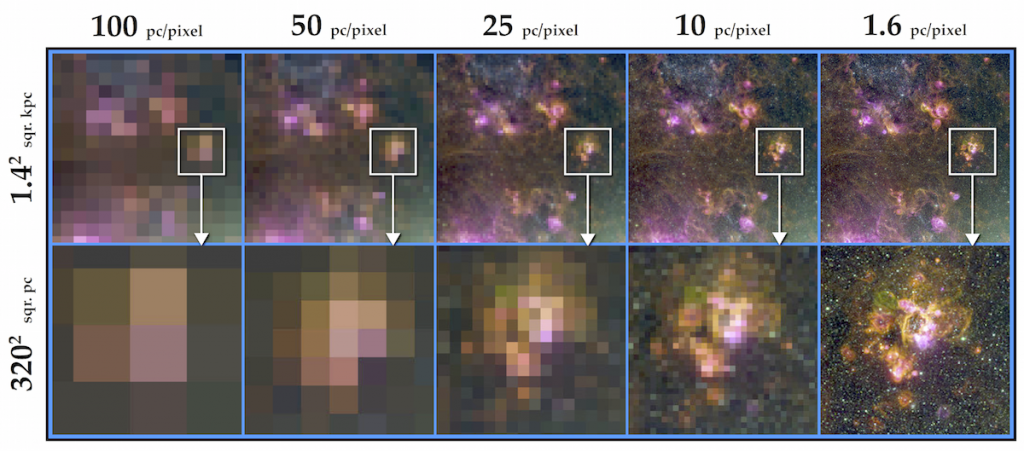
Broad-band (optical) and narrow-band ([O III], Hα, [S II]) imaging of the LMC (Smith et al. 2000). The left-hand column demonstrates sampling at a spatial resolution of 100 pc, typically achieved by the best IFU data currently available for external galaxies. The resolution increases to the right, ending with the ~1 pc resolution that LVM will achieve in the Milky Way. Note the qualitative change in appearance around 25 pc, when networks of shocks and ionization fronts become visible and then resolved at scales of less than 10 pc.
In order to efficiently survey nearby targets that have a large angular extent on the sky, LVM uses the LVM instrument (LVM-I), which consists of four new telescopes and newly built spectrographs located at the Las Campanas Observatory, in Chile. The science IFU covers a field of view nearly half a degree in diameter, with each of the 1801 fibers sampling 35.3” diameter scales with high (83%) filling factor. These large angular sizes are necessary to efficiently survey our targets, but correspond to physical scales of <1 pc in the Milky Way and ~10 pc in the LMC/SMC. The wavelength coverage of the spectrographs is 3600-9800 Å, with spectral resolution R~4000 (based on the DESI spectrograph design), covering emission lines and stellar continuum from the full optical spectral range. Over the course of its survey, the LVM is collecting roughly 55 million spectra over >4,300 square degrees of sky, including the midplane of the Milky Way, Orion, and the entirety of the Magellanic Clouds. A more thorough description of the survey footprint and strategy is found under LVM Targeting and Observing Strategy.
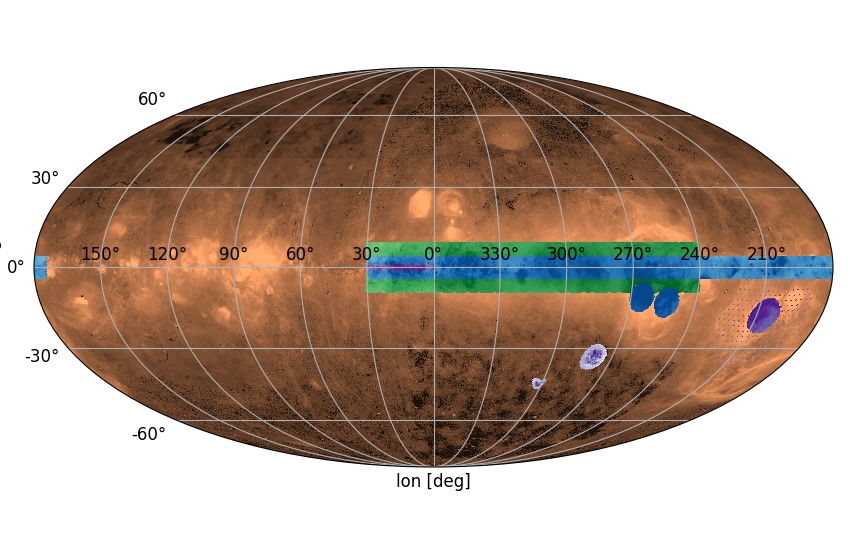
LVM footprint in Galactic coordinates, showing the midplane survey of the Milky Way (blue), the high-latitude extensions (green), and from left to right (purple): the Small Magellanic Cloud, Large Magellanic Cloud, and the Orion Nebula. For more detail on the LVM targets, and a view in equatorial coordinates, see the LVM targeting page. Background is a WHAM Hα image. Image credit: WHAM, N. Drory, E. Pellegrini.
For some guidelines about how to get started with LVM data, visit LVM Getting Started and the LVM Data Access page, and check out the LVMvis interactive data exploration tool. For more technical details, there are dedicated pages for the LVM Data Reduction Pipeline (DRP) and Data Analysis Pipeline (DAP), as well as several additional LVM pages linked in the sidebar at right.
Science Goals
Galaxy formation can be understood as a self-regulating process, with energy exchange between stars and interstellar gas occurring at numerous points in space and time. LVM is mapping the interstellar ionized gas emission of the Milky Way and Local Group galaxies with unprecedented spatial resolution: reaching sub-parsec resolution in the Milky Way, 10 parsec resolution in the Magellanic Clouds, and ~kiloparsec resolution out to distances of 5-20 Mpc. For bright lines, the spectral resolution is adequate to study velocity structure and turbulence in the ionized gas.
For the nearest Galactic star forming regions, like Orion, we achieve remarkably sharp views of individual massive stars producing ionized bubbles within their natal clouds of gas and dust.
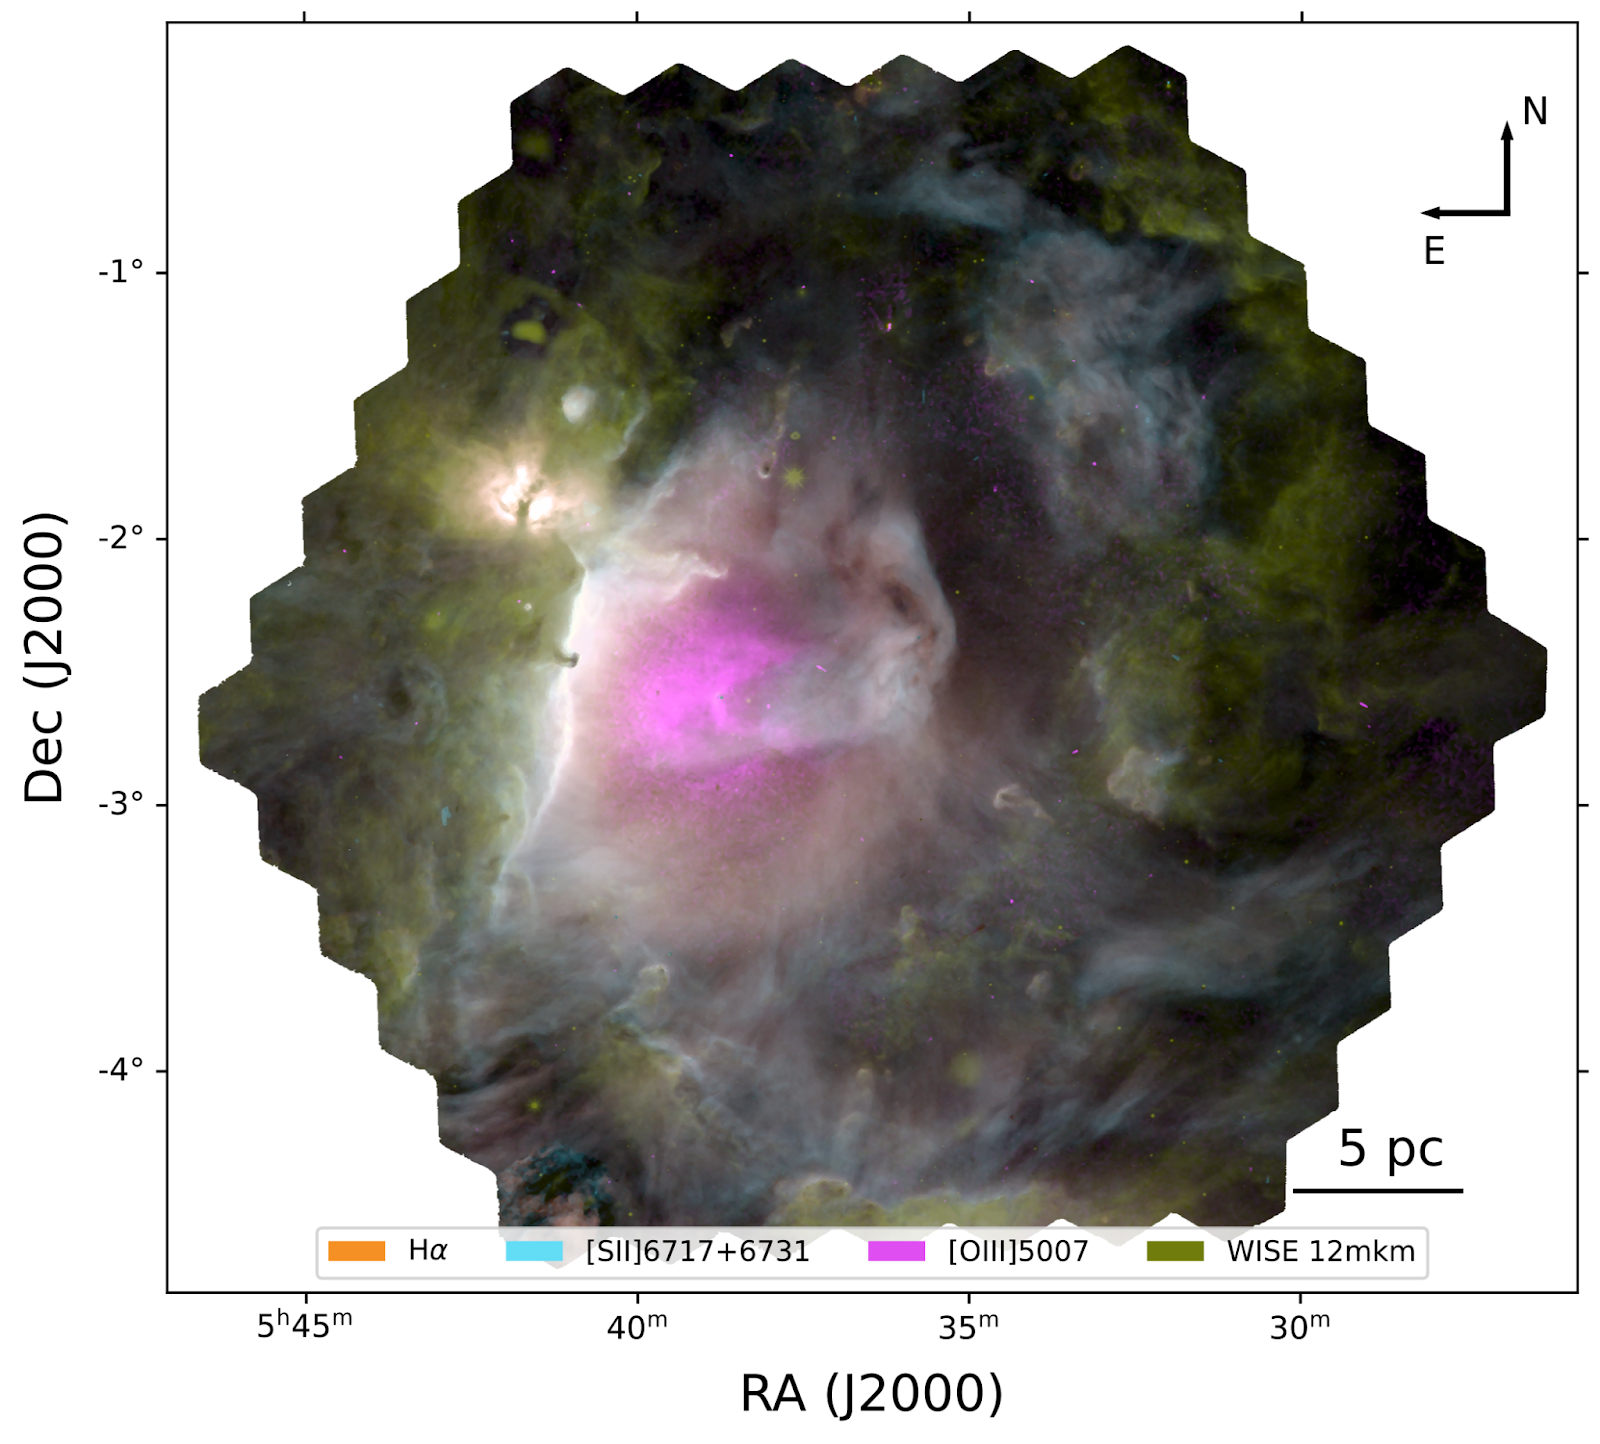
Mapping stellar feedback in Orion with the LVM. 108 individual LVM pointings cover 4 deg x 4 deg (30 pc x 30 pc). Colors show different emission lines (Hα: orange, [SII]λλ6717+6731: light blue, [OIII]λ5007: magenta) trace the ionization structure of the nebula, and carve a bubble into surrounding dense gas (WISE 12μm: yellow). The ionized gas emission traces wispy, filamentary structures and dusty eroding clouds and clumps. Adapted from Kreckel et al. (2024).
LVM is thus well-positioned to study star formation and the physics of the interstellar medium in great detail by distinguishing individual star formation knots and the filamentary structures and shock networks between them. LVM is able to connect studies across the parsec (molecular cloud) and kiloparsec (galaxy-wide) scales. This connection is fundamental to understanding the physics governing star formation, the structure of the interstellar medium, the baryon cycle, and ultimately, the evolution of galaxies.
Moreover, the fact that LVM can measure a multitude of both strong and weak emission lines provides unique opportunities to map the key characteristics of the ionized gas (density, temperature, and chemical abundance) and probe the dominant ionization mechanisms across different regions. Of particular value is the ability to cross-compare so-called “direct”, temperature-based abundances derived from collisionally excited metal lines (using temperature-sensitive auroral lines) to abundances derived from metal recombination lines, and use these to benchmark strong-line abundances (where temperatures and densities can not be constrained).
More details on the Local Volume Mapper and an extended description of its science goals can be found in Drory et al. 2024; “The SDSS-V Local Volume Mapper (LVM): Scientific Motivation and Project Overview”.
Contact information
For more information, contact the SDSS-V Program Head for the Local Volume Mapper, Sebastián Sánchez (Universidad Nacional Autónoma de México).