
Final BAO and RSD Measurements
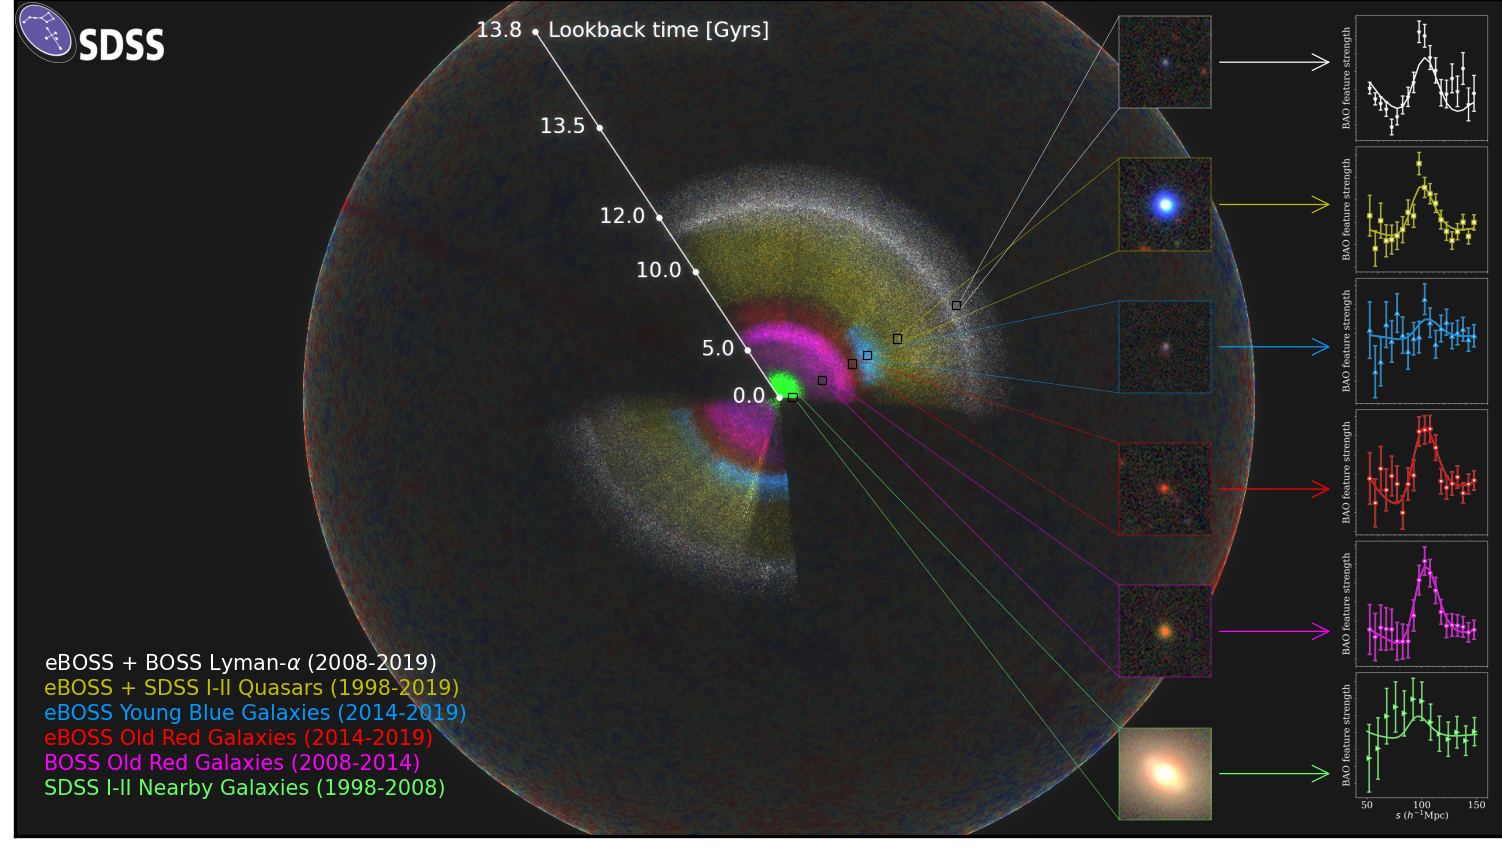
The SDSS-I and -II, BOSS, and eBOSS spectroscopic surveys provide galaxy and quasar samples out to redshifts z<3.5. The main tracers for these measurements are the low redshift galaxies (MGS) from the earlier phases of SDSS, the luminous galaxies from BOSS, luminous red galaxies (LRG) from eBOSS, emission line galaxies (ELG) from eBOSS, and quasars, primarily from BOSS and eBOSS. The three dimensional clustering in these samples was used to make 15 distinct, high precision measurements of Baryon Acoustic Oscillations (BAO) and six measurements of redshift space distortions (RSD). The aggregate precision of the expansion history measurements is 0.70% at redshifts z < 1 and 1.19% at redshifts z > 1, while the aggregate precision of the growth measurements is 4.78% over the redshift interval 0 < z < 1.5. With this redshift coverage and sensitivity, the SDSS experiment is unparalleled in its ability to explore models of cosmology.
Both BOSS and eBOSS used the upgraded 1000-fiber spectrographs that were installed at the 2.5 meter Sloan Telescope in 2009. The BOSS design and survey strategy are described in the 2009-2014 BOSS overview while the eBOSS scientific justification and survey plan are described in the 2014-2019 eBOSS overview. Key to the BAO and RSD measurements in SDSS, BOSS, and eBOSS are advanced processing of imaging data, carefully crafted target selection, well vetted catalogs of redshifts, weights, and randoms, clustering analysis, and assessment of statistical and systematic errors through mock catalogs.
The likelihoods, covariance matrices, and cosmoMC chains with the SDSS data can be found here. The background of these measurements for each of the SDSS cosmology samples can be found in the table below.
The table below may be cut off in your browser, so we also have a full-width version of the table.
| Parameter | Main Galaxy Sample (MGS) | BOSS Galaxy | BOSS Galaxy | eBOSS LRG | eBOSS ELG | eBOSS Quasar | Lyα-Lyα | Lyα-Quasar |
|---|---|---|---|---|---|---|---|---|
| Imaging, Target Selection, and Spectroscopic Properties of Each Sample | ||||||||
| Imaging for Target Selection | SDSS | SDSS | SDSS | SDSS + WISE | DECaLS | SDSS + WISE | SDSS + WISE + MISC | SDSS + WISE + MISC |
| Target Selection | g,r | g,r,i | g,r,i | g,r,i,z,W1 | g,r,z | u,g,r,i,z,W1,W2 | misc | misc |
| Spectroscopic Program | SDSS-I and -II | BOSS | BOSS | BOSS and eBOSS | eBOSS | primarily eBOSS | BOSS and eBOSS | BOSS and eBOSS |
| redshift range | 0.07 < z < 0.20 | 0.2 < z < 0.5 | 0.4 < z < 0.6 | 0.6 < z < 1.0 | 0.6 < z < 1.1 | 0.8 < z < 2.2 | z > 2.1 | z > 1.77 |
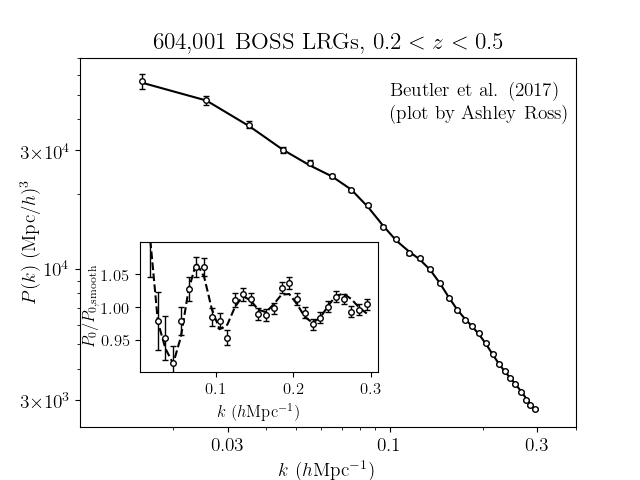
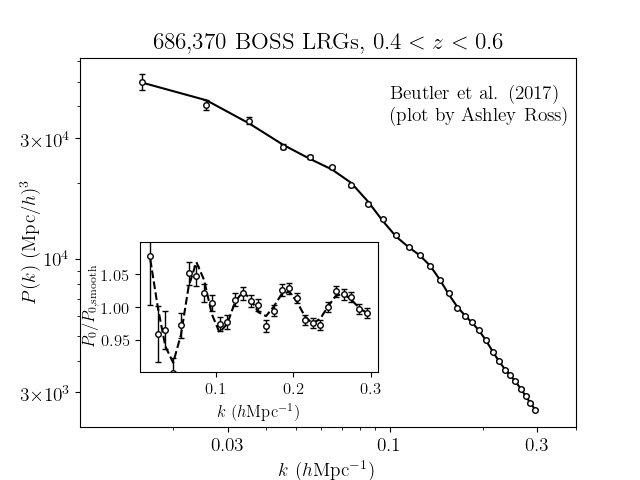
| Number of Tracers | 63,163 | 604,001 | 686,370 | 377,458 | 173,736 | 343,708 | 210,005 | 341,468 |
| Effective Redshift | 0.15 | 0.38 | 0.51 | 0.70 | 0.85 | 1.48 | 2.33 | 2.33 |
| Effective Volume (Gpc3) | 0.24 | 3.7 | 4.2 | 2.7 | 0.6 | 0.6 | ||
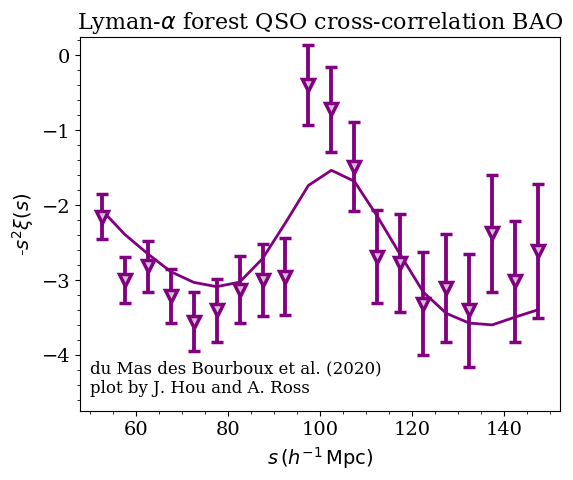
| Clustering Catalog Documentation | Ross et al. (2020) | Reid et al. (2016) | Reid et al. (2016) | Ross et al. (2020) | Raichoor et al. (2020) | Ross et al. (2020), Lyke et al. (2020) | du Mas des Bourboux et al. (2020), Lyke et al. (2020) | du Mas des Bourboux et al. (2020), Lyke et al. (2020) |
| N-body and Mock Catalogs | Kitaura et al. (2016) | Kitaura et al. (2016) | Zhao et al. (2020), Rossi et al. (2020) | Zhao et al. (2020), Lin et al. (2020), Alam et al. (2020), Avila et al. (2020) | Zhao et al. (2020), Smith et al. (2020) | Farr et al. (2020) | Farr et al. (2020) | |
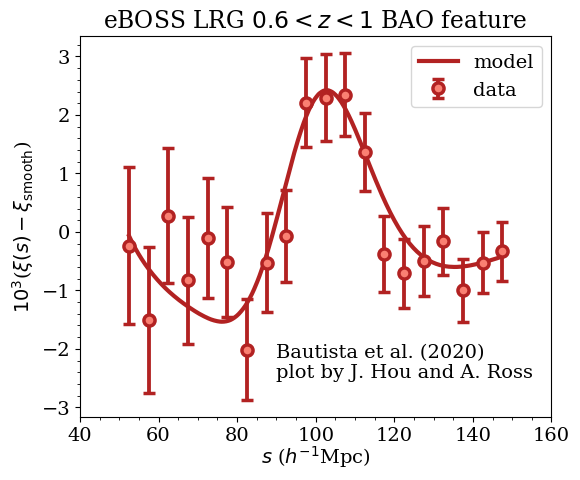
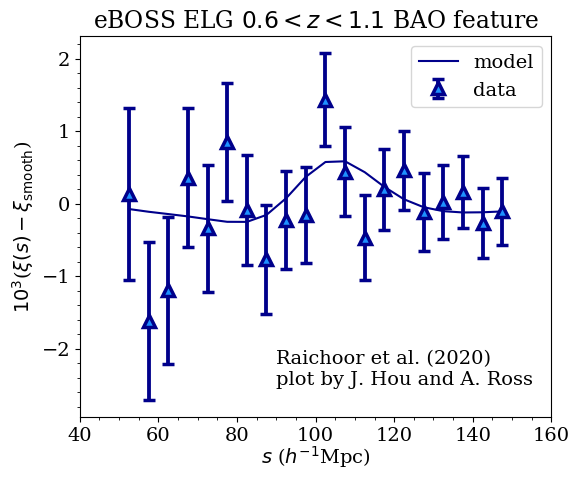
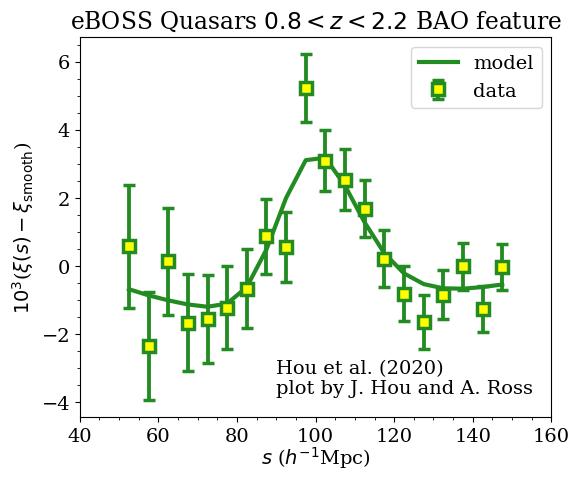
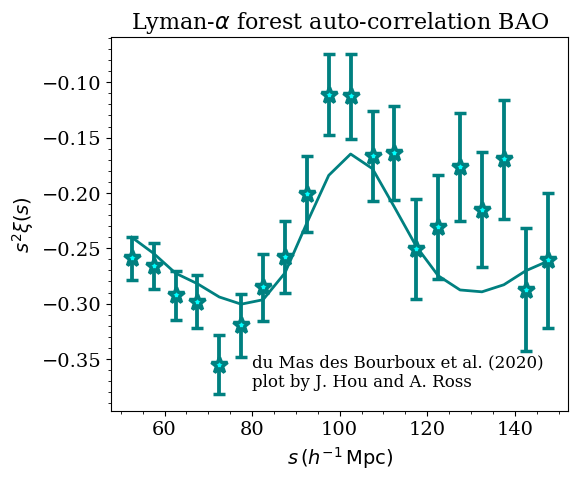
| BAO-only Measurements | ||||||||
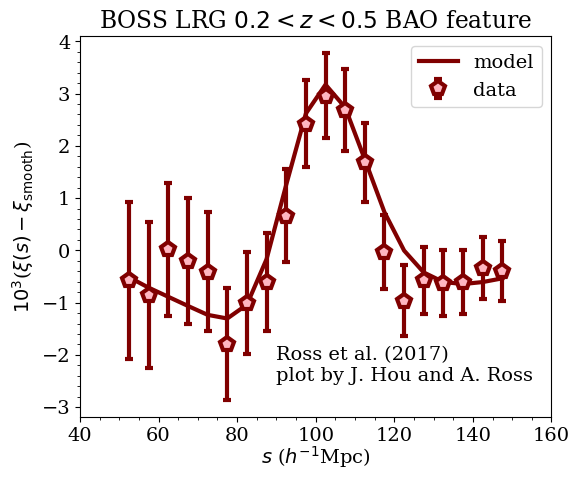
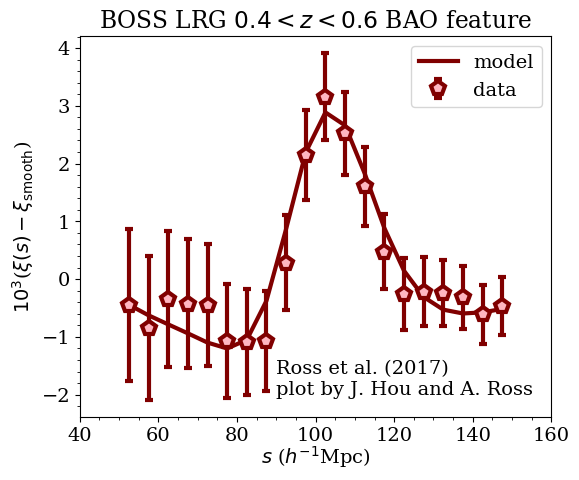
| Correlation Function Measurement | 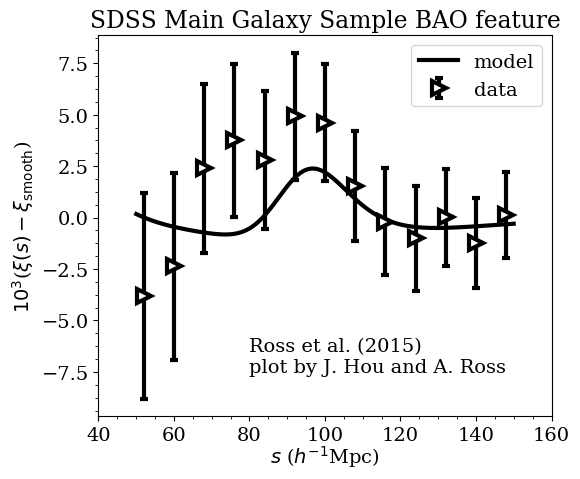 |
 |
 |
 |
 |
 |
 |
 |
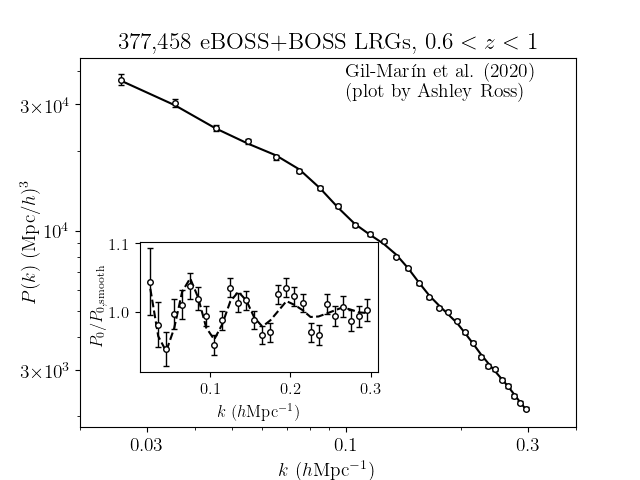
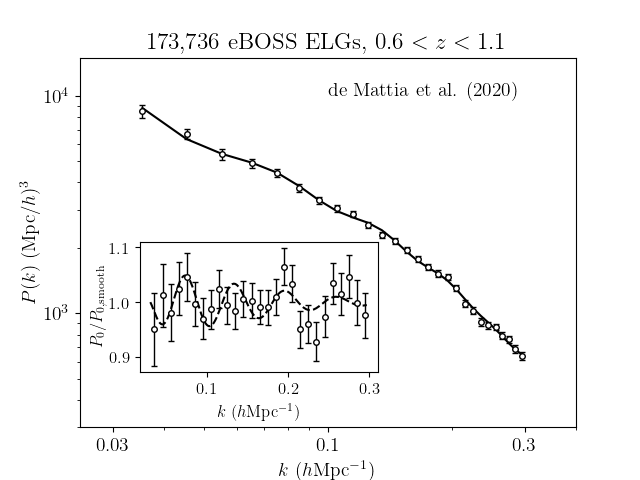
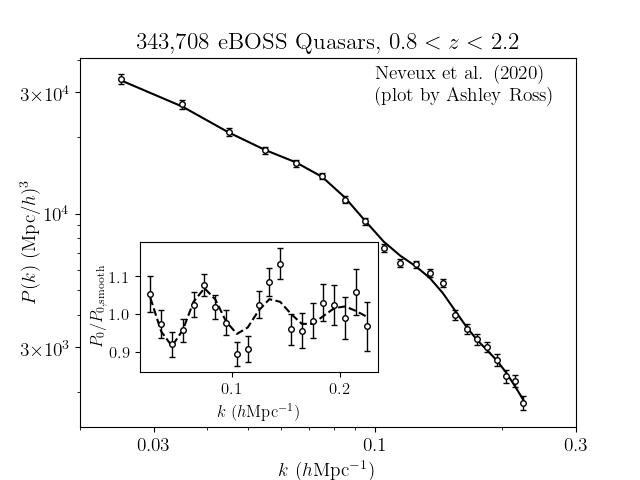
| Power Spectrum Measurement | 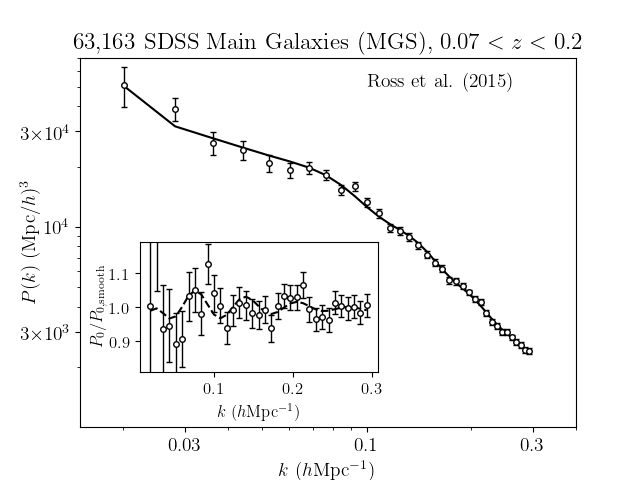 |
 |
 |
 |
 |
 |
||
| DV(z)/rd | 4.47 +/- 0.17 | 18.33-0.62+0.57 | ||||||
| DM(z)/rd | 10.23 +/- 0.17 | 13.36 +/- 0.21 | 17.86 +/- 0.33 | 30.69 +/- 0.80 | 37.6 +/- 1.9 | 37.3 +/- 1.7 | ||
| DH(z)/rd | 25.00 +/- 0.76 | 22.33 +/- 0.58 | 19.33 +/- 0.53 | 13.26 +/- 0.55 | 8.93 +/- 0.28 | 9.08 +/- 0.34 | ||
| Reference for final results | Ross et al. (2015) | BOSS Collaboration (2017) | BOSS Collaboration (2017) | Bautista et al. (2020), Gil-Marin et al. (2020) | Raichoor et al. (2020), de Mattia et al. (2020) | Hou et al. (2020), Neveux et al. (2020) | du Mas des Bourbuox et al. (2020) | du Mas des Bourbuox et al. (2020) |
| RSD Measurements | ||||||||
| Correlation Function Measurement | 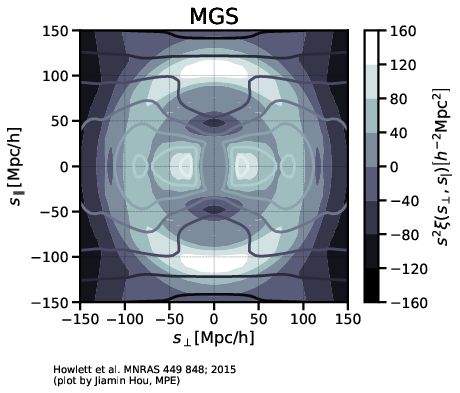 |
 |
 |
 |
 |
 |
||
| f σ8(z) | 0.53 +/- 0.16 | 0.500 +/- 0.047 | 0.455 +/- 0.039 | 0.448 +/- 0.043 | 0.315 +/- 0.095 | 0.462 +/- 0.045 | ||
| BAO+RSD Measurements | ||||||||
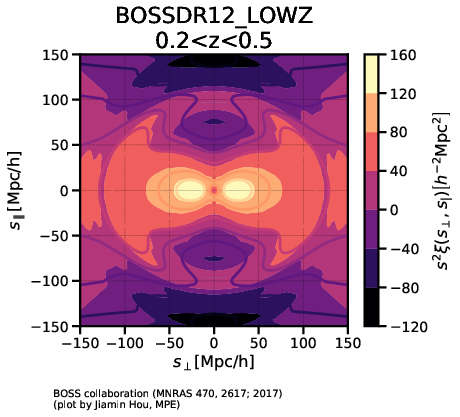
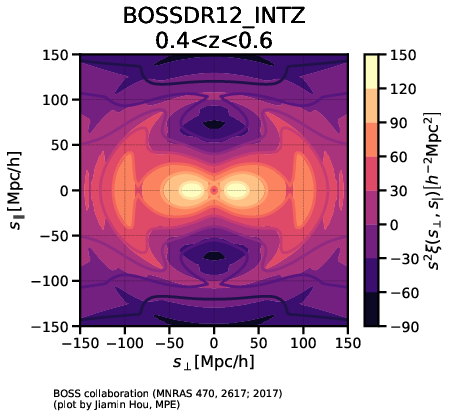
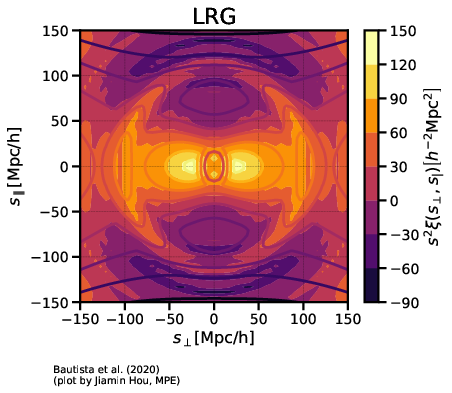
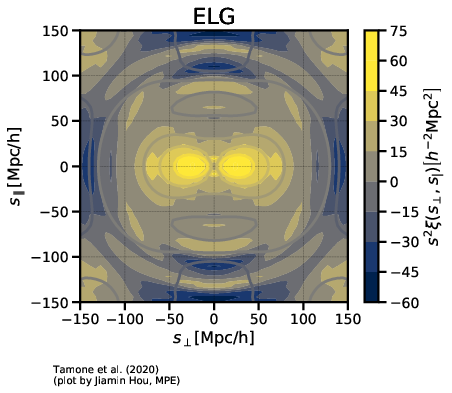
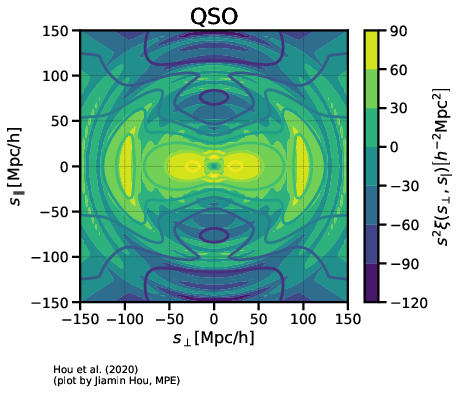
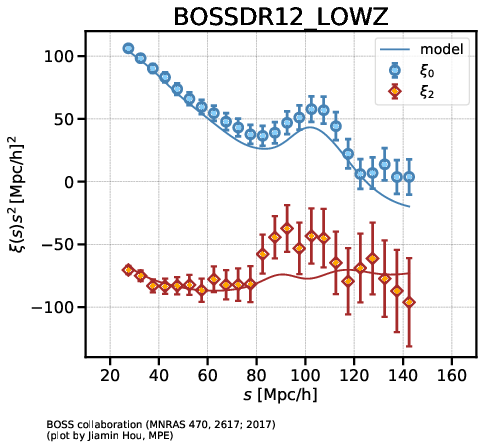
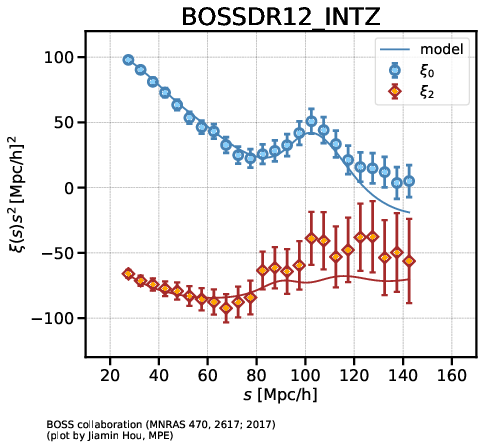
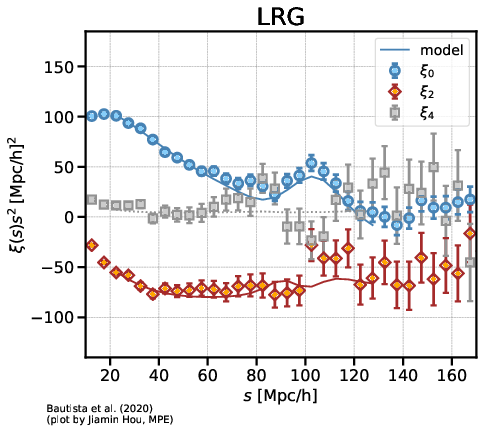
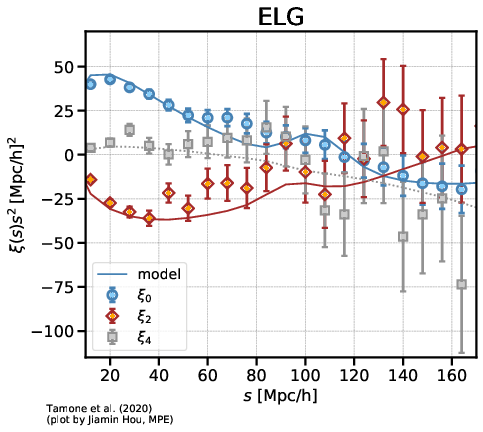
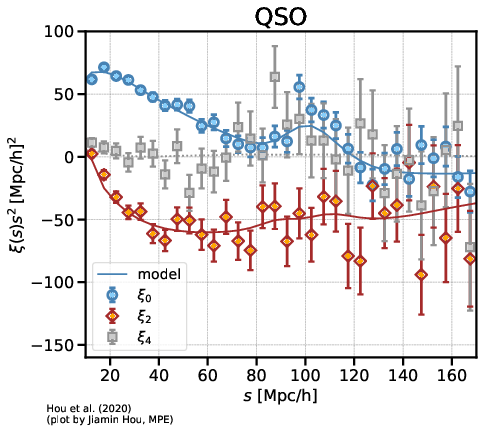
| Correlation Function Multipoles | 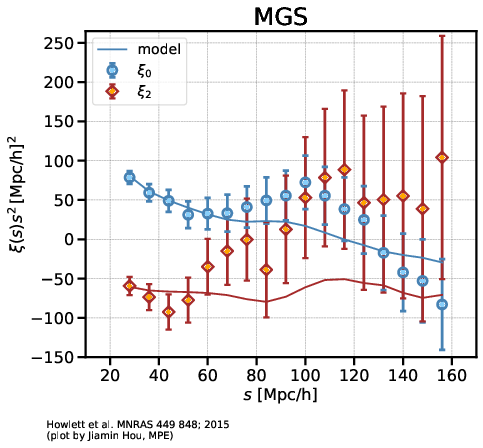 |
 |
 |
 |
 |
 |
||
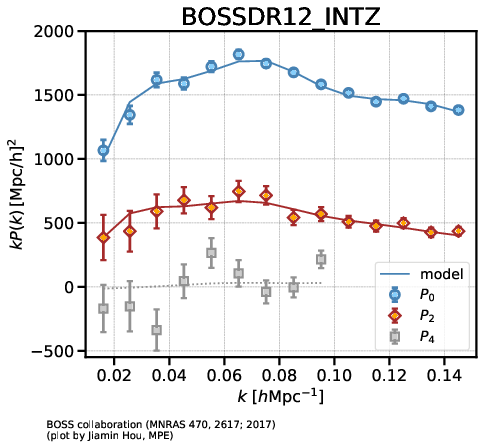
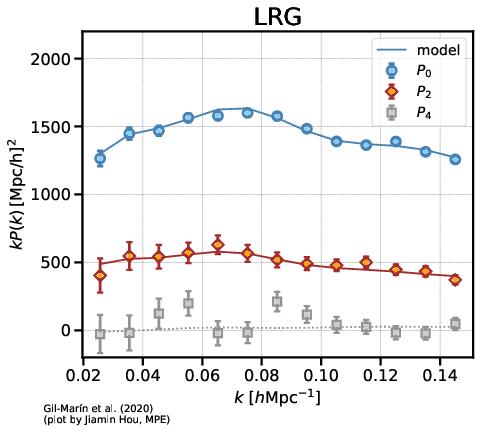
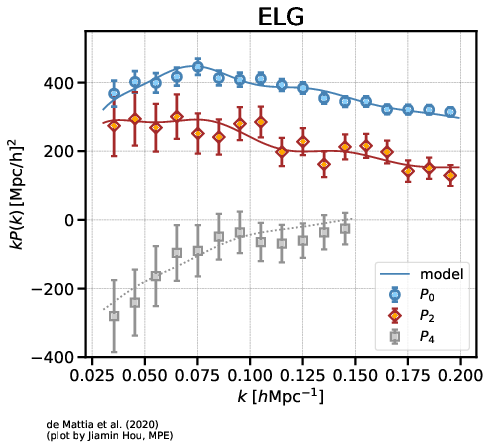
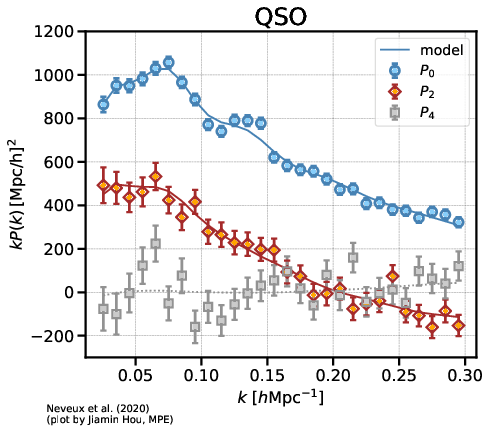
| Power Spectrum Multipoles | 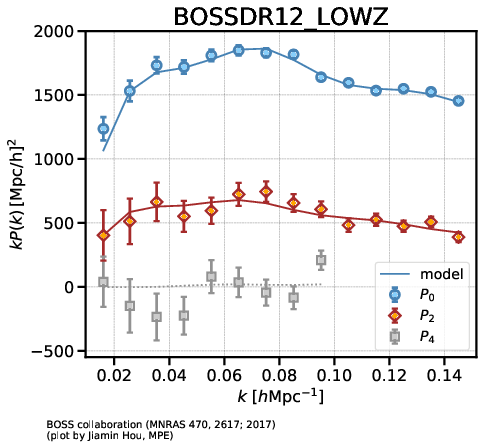 |
 |
 |
 |
 |
|||
| DV(z)/rd | 4.51 +/- 0.14 | |||||||
| DM(z)/rd | 10.27 +/- 0.15 | 13.38 +/- 0.18 | 17.65 +/- 0.30 | 19.5 +/- 1.0 | 30.21 +/- 0.79 | 37.6 +/- 1.9 | 37.3 +/- 1.7 | |
| DH(z)/rd | 24.89 +/- 0.58 | 22.43 +/- 0.48 | 19.78 +/- 0.46 | 19.6 +/- 2.1 | 13.23 +/- 0.47 | 8.93 +/- 0.28 | 9.08 +/- 0.34 | |
| f σ8 |
0.53 +/- 0.16 | 0.497 +/- 0.045 | 0.459 +/- 0.038 | 0.473 +/- 0.041 | 0.315 +/- 0.095 | 0.462 +/- 0.045 | ||
| Reference for final results | Howlett et al. (2015) | BOSS Collaboration (2017) | BOSS Collaboration (2017) | Bautista et al. (2020), Gil-Marin et al. (2020) | Tamone et al. (2020), de Mattia et al. (2020) | Hou et al. (2020), Neveux et al. (2020) | du Mas des Bourbuox et al. (2020) | du Mas des Bourbuox et al. (2020) |
Additional Cosmology Measurements
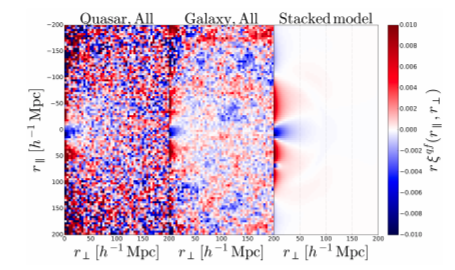 Measurements of the cross-correlation of the CIV forest with quasars allowed constraints on the clustering properties of CIV and indication that future surveys should be able to use this technique to measure BAO. Measurements of the cross-correlation of the Mg II forest with galaxies and quasars played a similar role, with detection of a feature consistent with BAO at a significance of χ2 = 7.25.
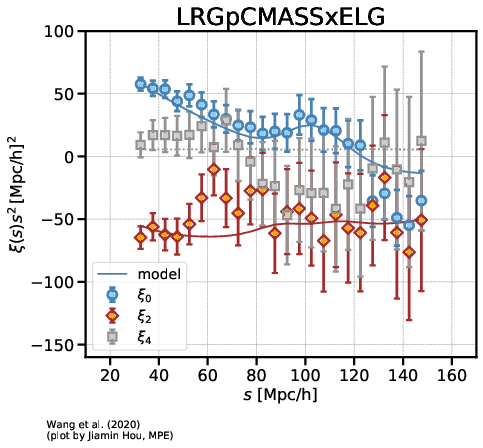
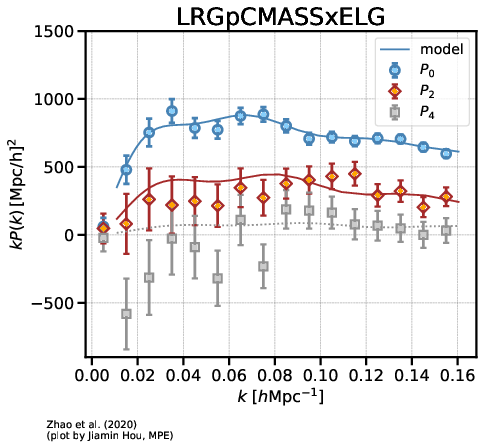 Multi-tracer BAO and RSD measurements in configuration space and Fourier space using the eBOSS LRG ELG samples are complementary to those above. The effective redshifts, central values of the BAO and RSD parameters, and covariance matrix are included in a compressed file for the configuration space measurement and in a compressed file for the Fourier space measurement
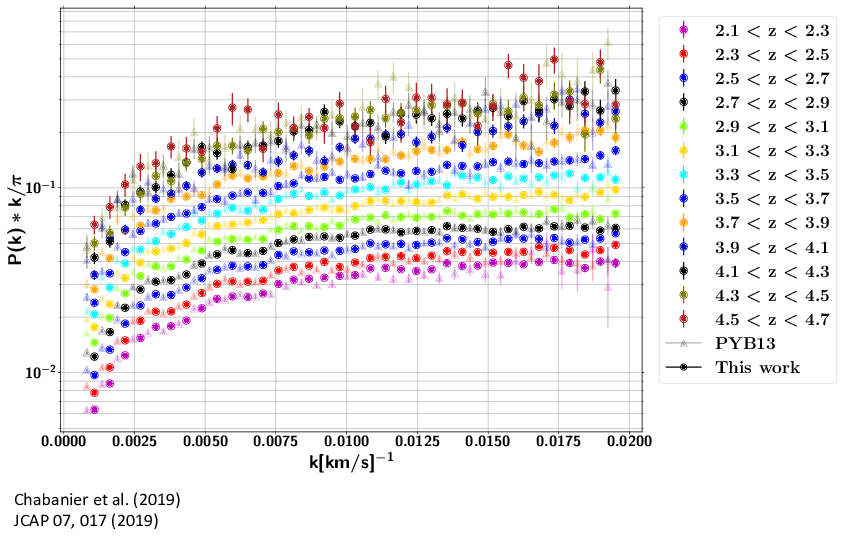 The one-dimensional power spectrum from the SDSS DR14 Lyman-alpha forests Measurements of the flux power spectrum over the redshift range 2.2 < z < 4.6 and scales up to k=0.02 (km/s)-1. Measurements are performed from a sample of 43,751 quasar spectra.
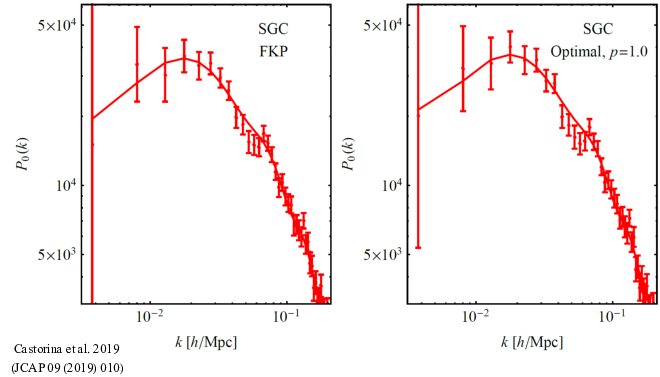 Constraints on primordial non-Gaussianity using eBOSS quasars led to constraints of -51 < fNLloc < 21 at the 95% confidence level. This is the tightest constraint on primordial non-Gaussianities using Large Scale Structure data alone.
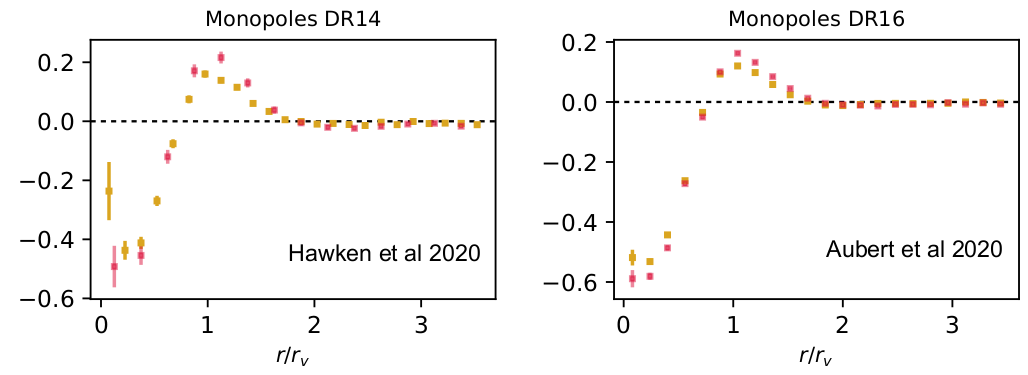 The first void detections in eBOSS were made using DR14 LRGs and quasars and later extended to the final eBOSS sample. Using the cross-correlation of these voids with other tracers allows complementary constraints on the linear redshift-space distortion parameter to those above.
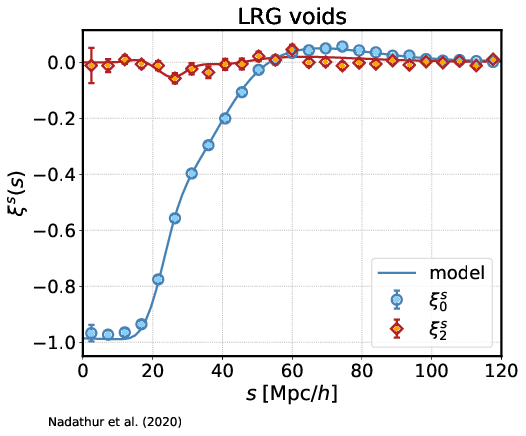 Measurement of the anisotropic void-galaxy correlation in the LRG sample allows measurement of the Alcock-Paczynski parameter ratio DM/DH and the growth rate of structure. This measurement is complementary to the BAO and RSD analyses above; combining the void results with galaxy clustering leads to a 55% reduction in parameter uncertainties for DM/rd, DM/rd and f σ8 for the eBOSS LRG bin.

